DVB Inspector
Digitalekabeltelevisie.nl
User manual
Bitrate view
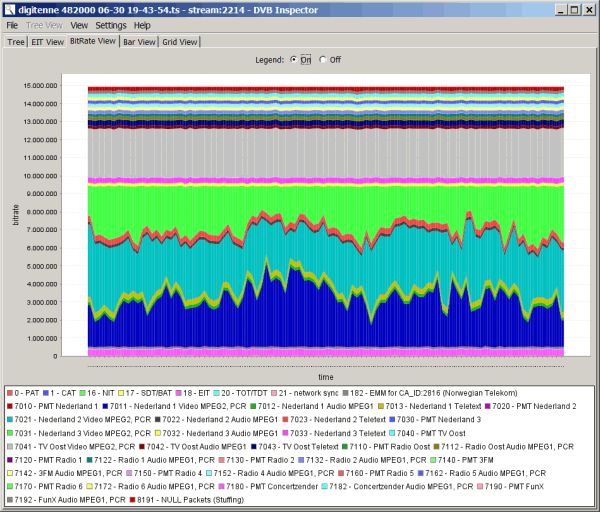
This bitrate view is based on the assumption that a complete
constant bitrate transport stream is analyzed. When used on a
partial transport stream with variable bitrate the results will
have no meaning.
Zoom
To zoom in on this chart click mouse button (left, middle or right) and select area of interest by dragging from top-left to bottom-right. Reset to original view by clicking mouse button and dragging from right to left, or bottom to top. Other way to zoom is to point at area of interest, and scroll mouse wheel up. Zoom out by scrolling mouse wheel down. Or you can right-click, and use the context-menu.
Panning
When zoomed in you can pan to another part of the graph by holding the CTRL-button and moving the mouse.
Legend
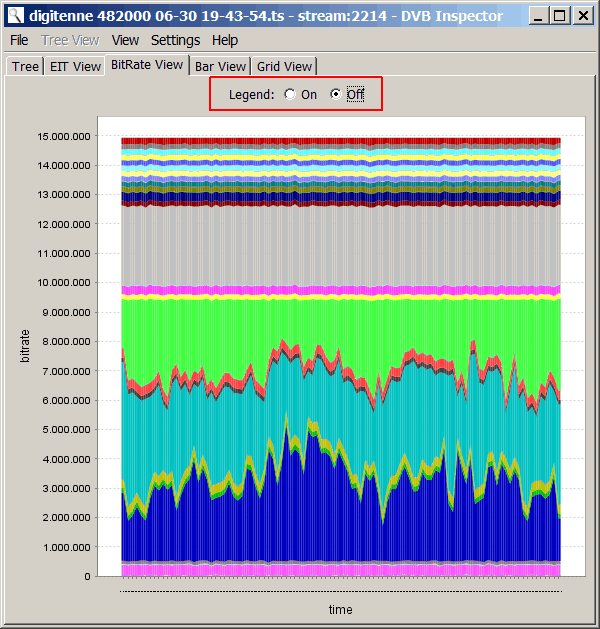
When there are a lot of PIDs the legend may take up to much space. With the radio buttons on the top the legend may be switched off.
Filter
 Select View -> Filter to
display this filter. It can be used to customize the bit rate, the
bar, the grid view and the PCR/PTS/DTS View.
Select View -> Filter to
display this filter. It can be used to customize the bit rate, the
bar, the grid view and the PCR/PTS/DTS View.
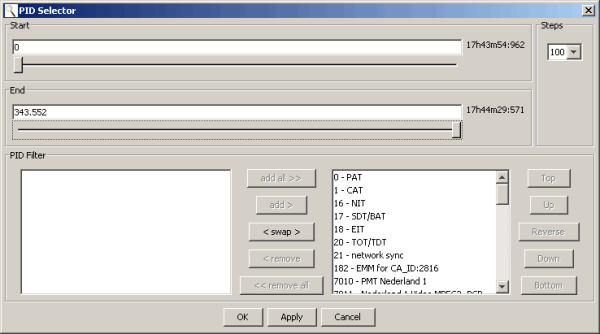
With the sliders at the top the start and end moment can be changed. This makes it possible to zoom in on a small interval. This control is not idiot proof, it is possible to set a later start moment than the end moment. However, the result will be without meaning.
The "steps" drop down changes the number of steps used to draw the chart, and calculate minimum and maximum values.
The PID filter section determines which PID are used in the charts. PIDs in the left list are not used, PIDs in the right list are. It is also possible to change the order of the PIDs.
Examples
video only PIDs
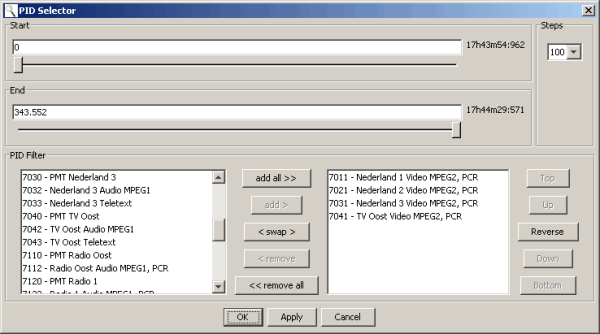
When you are interested in only the video bit rates remove all
other PIDs from the right list. (Easiest is to use "swap" to remove
all, than add only the MPEG2 Video PIDs back to the right list)
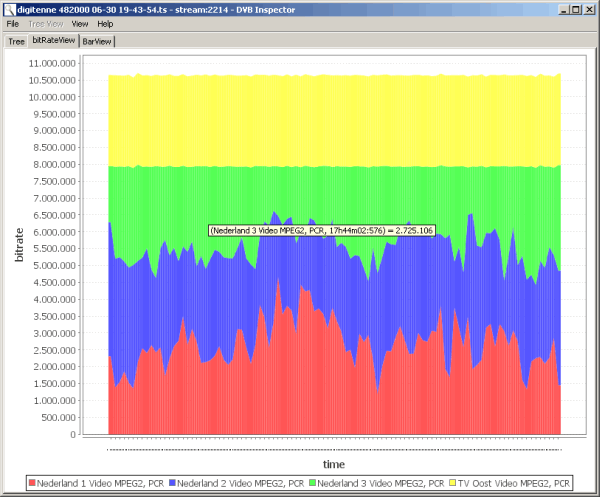
The bit rate chart showing only the video PIDs. When putting the
mouse over the chart, exact values are shown for that PID at that
moment.
DVB-H Zoom
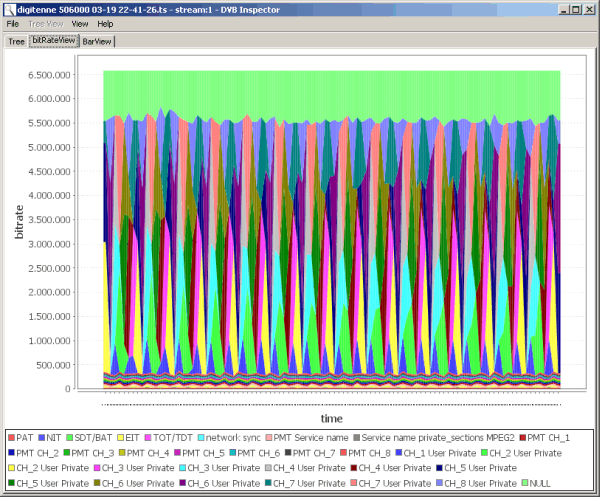
This is the default bit rate display for a 31 second capture of the
DVB-H (Handheld)service of KPN. It looks 'weird' on first
impression.
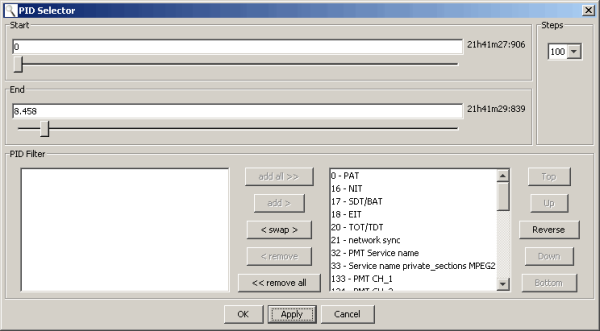
We use the filter to zoom in on the first part (8.458 TS packets,
or about 2 seconds).
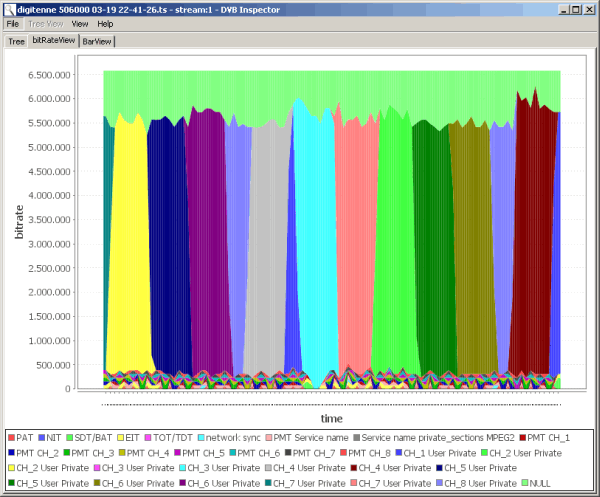
Now this chart makes much more sense, it clearly shows the time
slicing used by DVB-H. On DVB-H large pieces of data are
transmitted in bursts, allowing the receiver to be switched off in
inactive periods. This saves energy for the mostly battery operated
devices.
This page was last modified on 29/10/2017